Rental supply and affordability: what official data says in 2026
Official figures from the ONS and English Housing Survey show private renters in England spent 36.3% of income on rent in 2024, while the sector held steady at 19% of households.
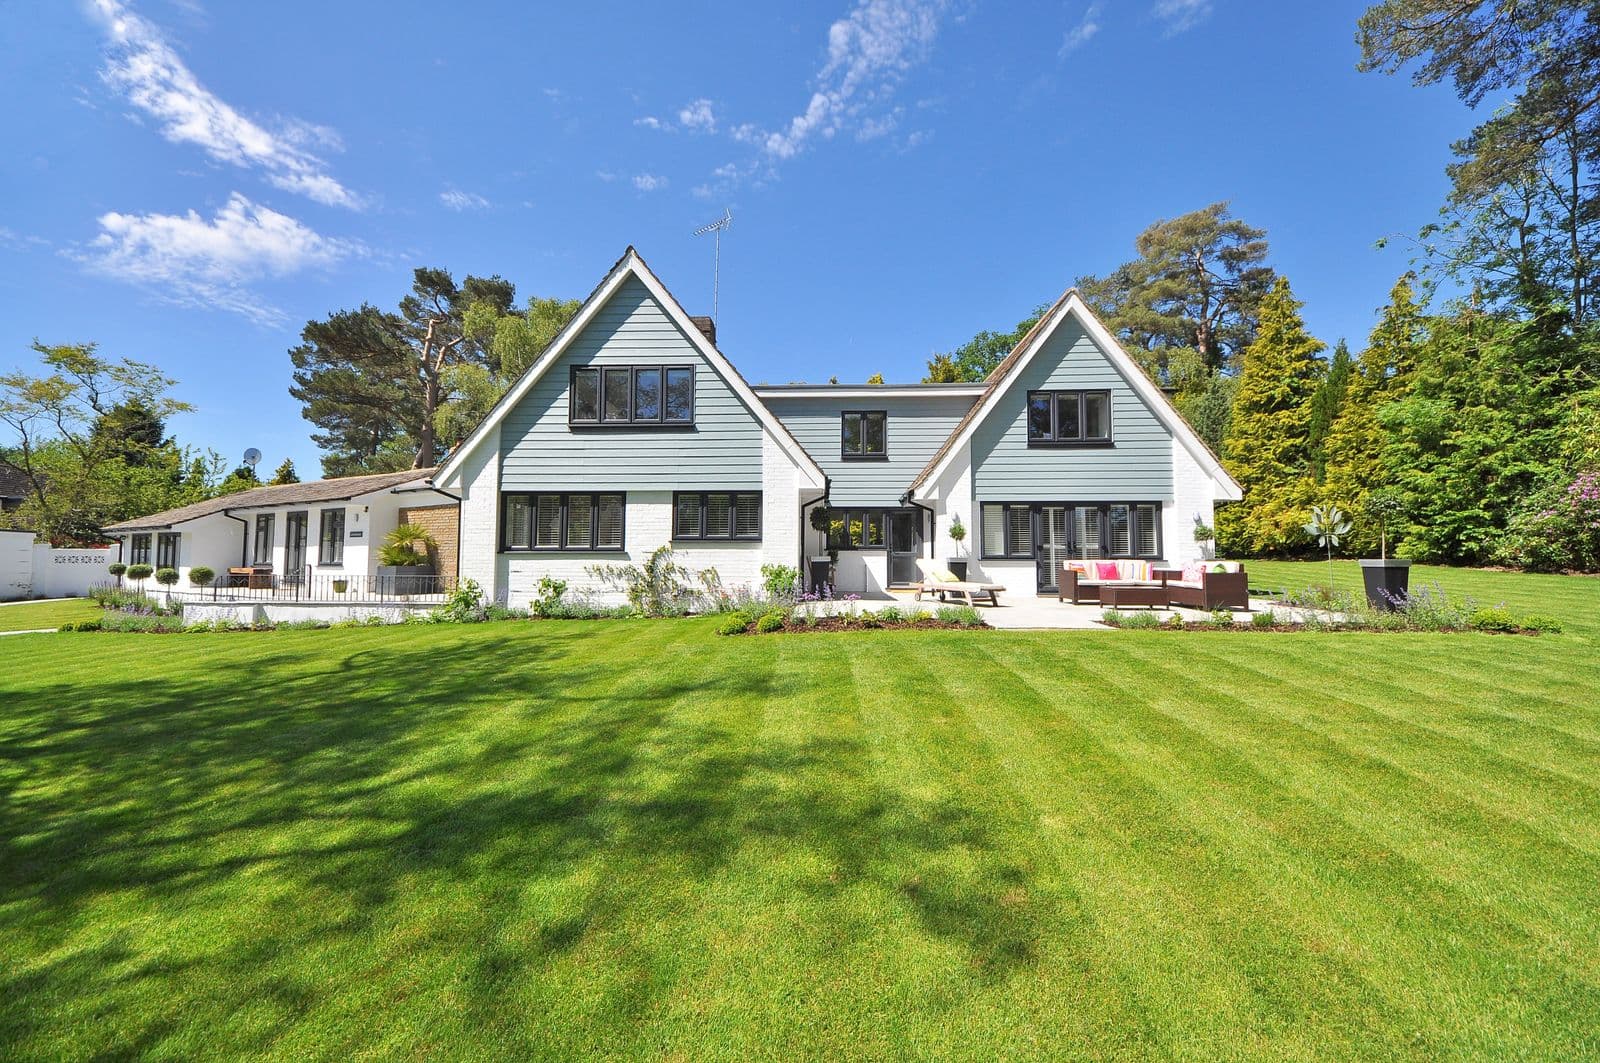
Image: Pexels
Private renters in England on a median household income could expect to spend 36.3% of their income on an average-priced rented home in the financial year ending 2024, the ONS reported in August 2025. The private rented sector accounted for 4.7 million households, or 19% of all households in England, in 2024 and 2025, according to the English Housing Survey published in December 2024.
Both data sets offer a picture of rental supply and what households spend. The ONS measure compares average monthly rents with the median gross income of private renting households. The English Housing Survey interviews thousands of households each year and asks about tenure, income and housing costs.
How large is the private rented sector?
The English Housing Survey reported in December 2024 that the private rented sector accounted for 4.7 million households, or 19% of all households in England, in 2024 and 2025. The sector has remained at around 19% or 20% since 2013 and 2014, following growth through the 2000s. Throughout the 1980s and 1990s, the proportion of private rented households was relatively steady at between 9% and 11%, the survey noted.
In terms of dwellings rather than households, there were 4.9 million private rented properties in 2024, representing 19% of all dwellings in England, the survey reported in December 2024. The private rented sector contained 518,000 vacant dwellings, which made up 11% of private rented stock. That vacancy rate was higher than the social rented sector at 4% and the owner occupied sector at 3%.
Owner occupation remained the largest tenure group in England at 65% of households in 2024 and 2025, followed by the private rented sector at 19%, with the social rented sector being the smallest at 16%, the English Housing Survey stated in December 2024.
HighlightThe private rented sector has doubled in size since the early 2000s but the proportion has held steady at 19% to 20% since around 2013 and 2014, official survey data shows.
What share of income do private renters spend on rent?
The ONS published a private rental affordability bulletin in August 2025 covering the financial year ending March 2024. It reported that private renters on a median household income in England could expect to spend 36.3% of their income on an average-priced rented home. The average monthly rent was £1,232, compared with a median monthly income of £3,396 for private renting households.
The ONS considers an area affordable if a private renting household would spend 30% or less of their gross income on rent. By that measure, England as a whole was above the affordability threshold in the financial year ending 2024. Private rental affordability in England has fluctuated since 2016 but remained above the 30% threshold throughout the series, the ONS stated in August 2025.
The English Housing Survey uses a different method. It reported in July 2026 that on average, private renters spent 34% of their household income on rent in 2024 and 2025, with housing support included in income. If income from housing support was excluded in the calculation, the average proportion of income spent on rent was 39% for private renters, the survey noted.
An older English Housing Survey report covering 2016 and 2017, published in July 2018, found that on average households in the private rented sector spent 34% of their income on rent, including Housing Benefit. Excluding Housing Benefit, the average proportion was 39%. The consistency of those figures across several years suggests the income share spent on rent by private renters has remained relatively stable over time.
How does affordability vary by region?
London was the least affordable region in the financial year ending 2024, with average rents of £1,957 per month, or 41.6% of private renter household income, the ONS reported in August 2025. The most affordable region in England was the North East, with average rent prices of £641 per month, or 19.8% of private renter household income. This was followed by the East Midlands and Yorkshire and The Humber.
The ONS noted in August 2025 that London's private rental affordability ratio was 41.6% in 2024, keeping England's affordability ratio above the 30% affordability threshold, despite most English regions being below the threshold. Average rents in London have been between 38.5% and 57.0% of private rented household incomes since the financial year ending 2016, while in other regions they have remained between 19% and 36%, the bulletin stated.
At local authority level, the most affordable area in the financial year ending 2024 was Hartlepool, where the average renting household could expect to pay £524 monthly rent, or 15.9% of a modelled household income of £3,305, the ONS reported in August 2025. The least affordable was Kensington and Chelsea, at 74.3% of median income, which has been the least affordable in all nine years of the series.
The English Housing Survey reported in July 2026 that the average mean private rent in London was £393 per week in 2024 and 2025, compared to £207 per week outside of London. The average social rent was £171 per week in London, compared to £119 per week in the rest of England.
How do private renters compare with other tenures?
The English Housing Survey reported in July 2026 that on average, mortgagors spent 19% of their household income on mortgage payments in 2024 and 2025, whereas rent payments were 28% for social renters and 34% of household income for private renters, with housing support included in income. If income from housing support was excluded, the average proportion was 39% for both private and social renters.
The 2016 and 2017 English Housing Survey report, published in July 2018, found that on average, households in the private rented sector spent 34% of their income on rent, including Housing Benefit. Social renters spent on average 28%. By comparison, owner occupiers spent an average of 18% of their household income on mortgage payments.
In 2024 and 2025, 24% of private renters, or 1.1 million households, received housing support to help with the payment of their rent, the English Housing Survey reported in December 2024. That proportion had remained the same as in 2023 and 2024 and 2022 and 2023. By contrast, 65% of social renters, or 2.6 million households, received housing support in 2024 and 2025.
Around 52% of private renters had savings or money invested in 2023 and 2024, the English Housing Survey reported in November 2024. That was higher than social renters at 28%, but lower than owner occupiers at 85% for outright owners and 71% for those buying with a mortgage.
What do the figures mean for renters and landlords?
The data show that the private rented sector has remained stable in size as a proportion of all households for more than a decade. The share of income that private renters spend on housing costs has also remained relatively consistent over several years, though it varies widely by region and local area.
Private renters on average spend a higher proportion of their income on housing than mortgagors but a similar proportion to social renters when housing support is excluded from the calculation. London stands out for much higher rents relative to income than other English regions.
The ONS noted in August 2025 that private rental households' incomes have increased faster than rents in England since 2016, but since 2021, as rents started increasing more rapidly, incomes have continued to increase faster than rents in England. The picture differs in Wales and Northern Ireland, where incomes increased slower than rents over the same period.
For anyone considering whether to rent or buy, or thinking about how long to save for a deposit, these official measures provide context on what households in the private rented sector currently spend. Personal circumstances vary widely, and anyone making housing or financial decisions may wish to speak to a qualified, regulated adviser.
Common questions
- What percentage of income do private renters in England spend on rent?
- Private renters in England on a median household income could expect to spend 36.3% of their income on an average-priced rented home in the financial year ending March 2024, the ONS reported in August 2025. The English Housing Survey found that private renters spent on average 34% of household income on rent in 2024 and 2025, with housing support included in income.
- How many households are in the private rented sector in England?
- The private rented sector accounted for 4.7 million households, or 19% of all households in England, in 2024 and 2025, the English Housing Survey reported in December 2024. That proportion has remained around 19% to 20% since around 2013 and 2014, following growth through the 2000s.
- Which region of England has the most affordable private rents?
- The North East was the most affordable region in the financial year ending 2024, with average rent prices of £641 per month, or 19.8% of private renter household income, the ONS reported in August 2025. London was the least affordable, with rents of £1,957 per month, or 41.6% of private renter household income.
- How do private renters compare with mortgagors on housing costs?
- On average, mortgagors spent 19% of their household income on mortgage payments in 2024 and 2025, whereas private renters spent 34% of household income on rent with housing support included, the English Housing Survey reported in July 2026. If housing support is excluded, private renters spent 39% of income on rent.
- What does the ONS mean by affordable private rent?
- The ONS considers an area affordable if a private renting household would spend 30% or less of their gross income on rent. England as a whole was above this threshold in the financial year ending 2024, at 36.3% of median household income, the ONS reported in August 2025.
Sources
Figures in this post come from these publications. Check the originals for the latest position.
- Private rental affordability, England, Wales and Northern Ireland: 2024 (opens in a new tab), Office for National Statistics
- English Housing Survey Headline Report 2024-25 (opens in a new tab), Ministry of Housing, Communities and Local Government
- Chapter 2: Housing costs and affordability (opens in a new tab), Ministry of Housing, Communities and Local Government
- English Housing Survey: Private rented sector 2016-17 (opens in a new tab), Ministry of Housing, Communities and Local Government
bythenumbers provides general information from published open data. It is not financial, legal, survey or property valuation advice, and figures may be out of date or incomplete. Always check anything that matters to your decision directly with the relevant authority.